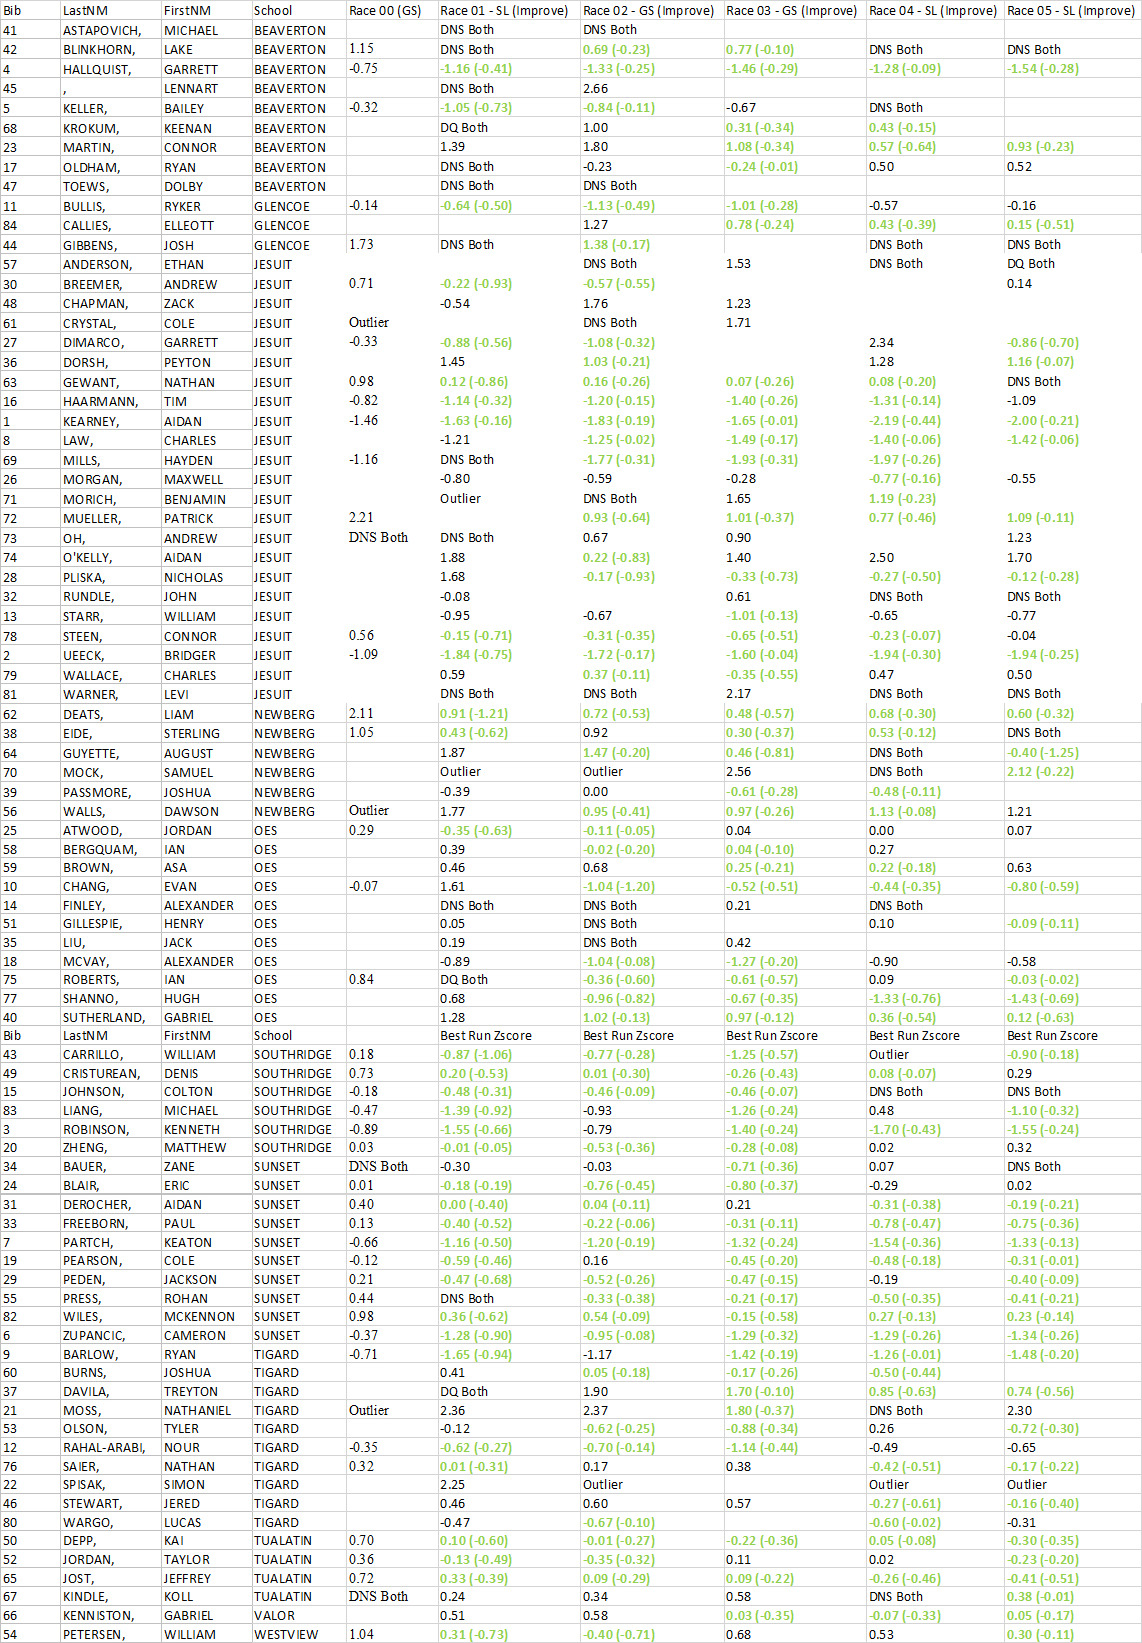
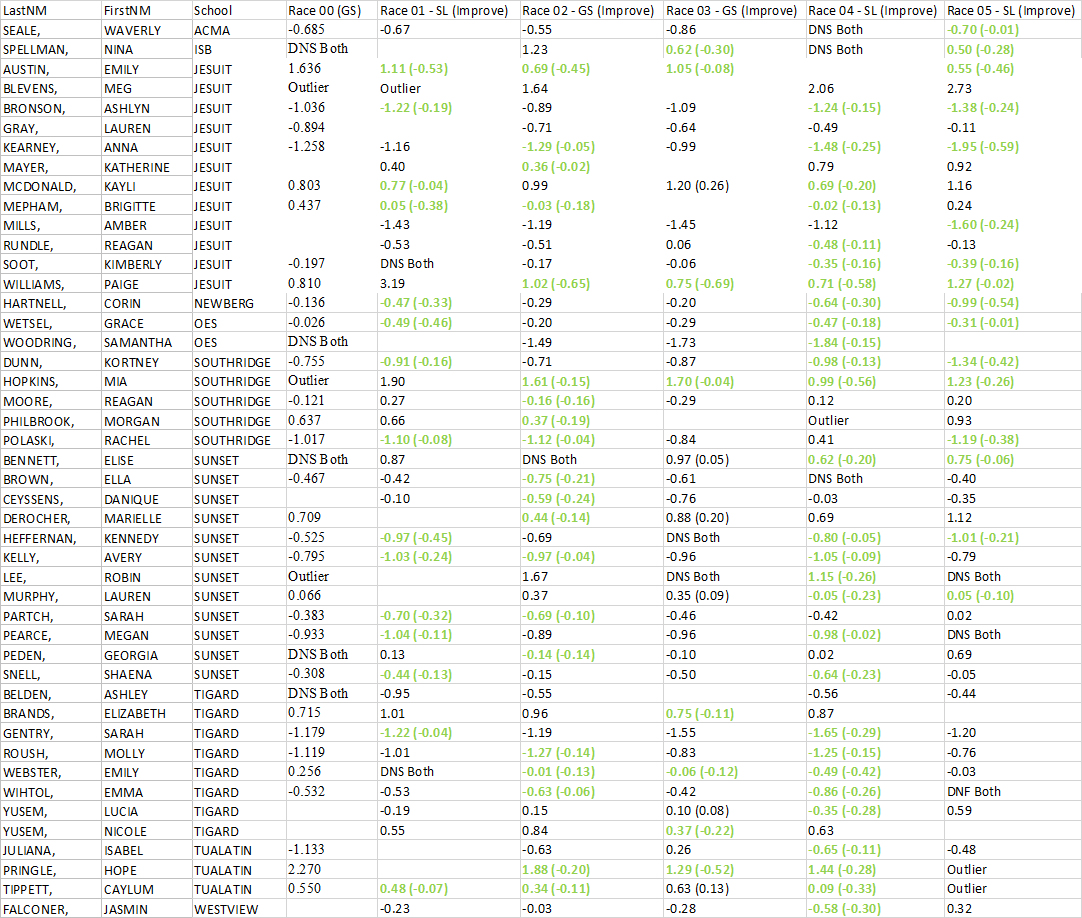
Portland Oregon Metro League Improvement Tables
The tables present the Portland Metro Ski League race results transformed into Z scores so that the results of different races can be compared. A Z-score is a measure of how far a skier's race time is from the average race time for the group. A Z score of zero is a time that is equal to the average for the group. One can have a Z score which is slower than the average (a positve number) or a Z score that is faster than the average ( a negative number). Z scores are measured in standard deviations. In order to represent each skiers best ability, the table uses each skier's best run in each race as the basis for analysis. If a skier did not start, did not finish, or disqualified for both runs, it is indicated. The transfromation allows one to a compare a skier's results across different races and to calculate an average performance for each skier. This is the heart of the tables usefulness. For each race, the table presents a comparison of each skier's performance to their own average past performance. Thereby, the data presents an ongoing measure of each skiers improvement - or lack thereof. If the skier's Z score for a race is faster than that skier's average of all previous races, then the score for that race is highlighted in green to indicate improvement. Cells without green, indicate non-improvement. The amount of improvement is shown in the parentheses and are measured in standard deviations. You can think of the average of a skier's past races as something like a racing GPA as a ski racer and the current result as the skier's current grade in that race. Improvement is defined as a Z score for a race which is lower (faster) than the individual's own average past performance.
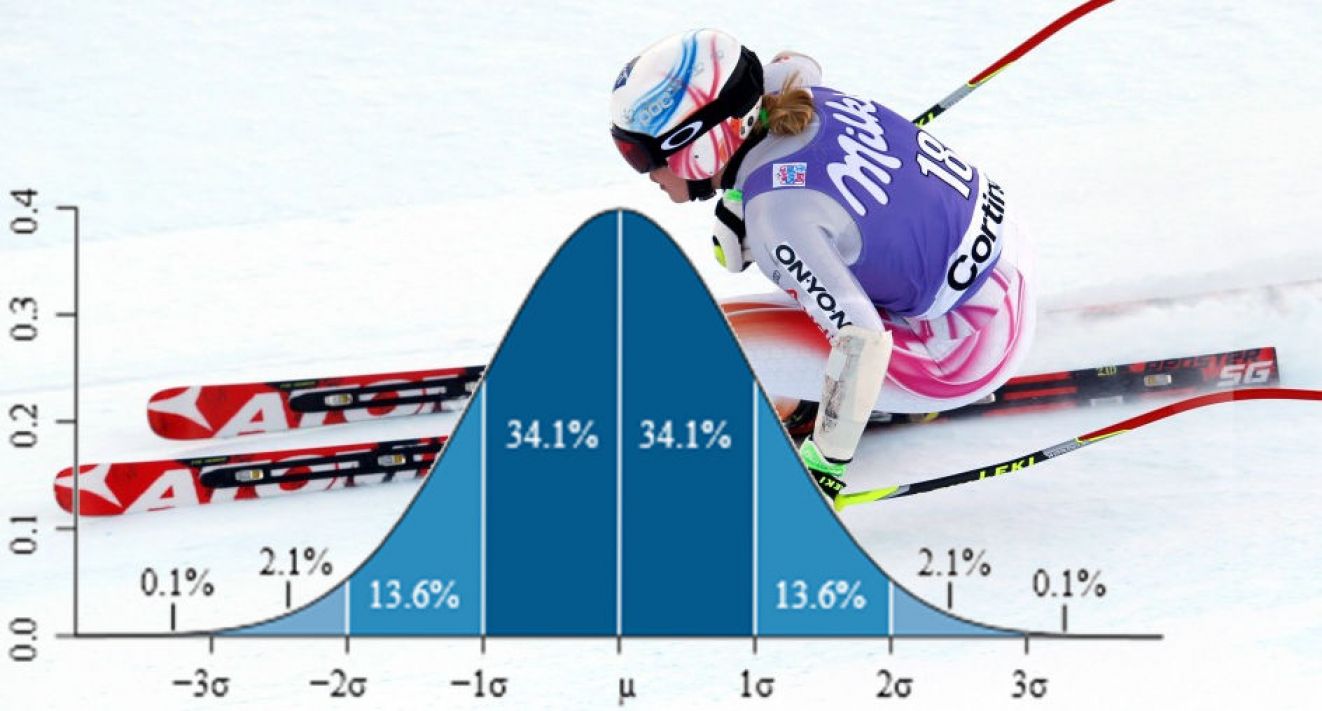
Readers that are familiar with Z-scores should jump right to the tables. If the reader has not used Z-scores before, the following description may help give enough of an understanding to generally interpret the table without going into the mathematics. Draw a horizontal line on a long piece of paper and places each of a racer's times from a race on the line in order from left to right with the left end being the lowest times. Now calculate the average time and mark that point on the line with a zero. It should be somewhere near the middle of the line. Times that are slower than the average fall on the right end of the line and are given a positive value (+) Times that are faster are given a negative value and stretch toward the left. The Z-score for each time represents how far (positive or negative) that time is from the average for the group. If we do this for every race and track individuals placements in relation to each race's average, improvement would be defined as any movement toward the left (i.e., toward a lower time). note that one can be improving even if all one's scores are on the positive end as long as the change in scores trend toward the left.
If you are a skier in the table, consider anything over 0.1 in improvement as worth noting. A skier that improves several tenths has made significant progress. If you improved on a race, ask yourself what you did in your technique, tactics, and preparation to make that happen. If you did not improve on a race, as yourself what you will do differently in technique, tactics, or preparation in the next race. Discuss your ideas with your coaches and team mates. Note: it is possible that you can improve a specific technical aspect of your skiing during a race, but have slower time while you are learning the change. Be patient. Over time, that technical acheivement will eventually translate into lower race times as you learn how to apply it with the right tactics. If you want to learn more about how this table is created, read more here. Check your results:
2019/20 Portland Metro League
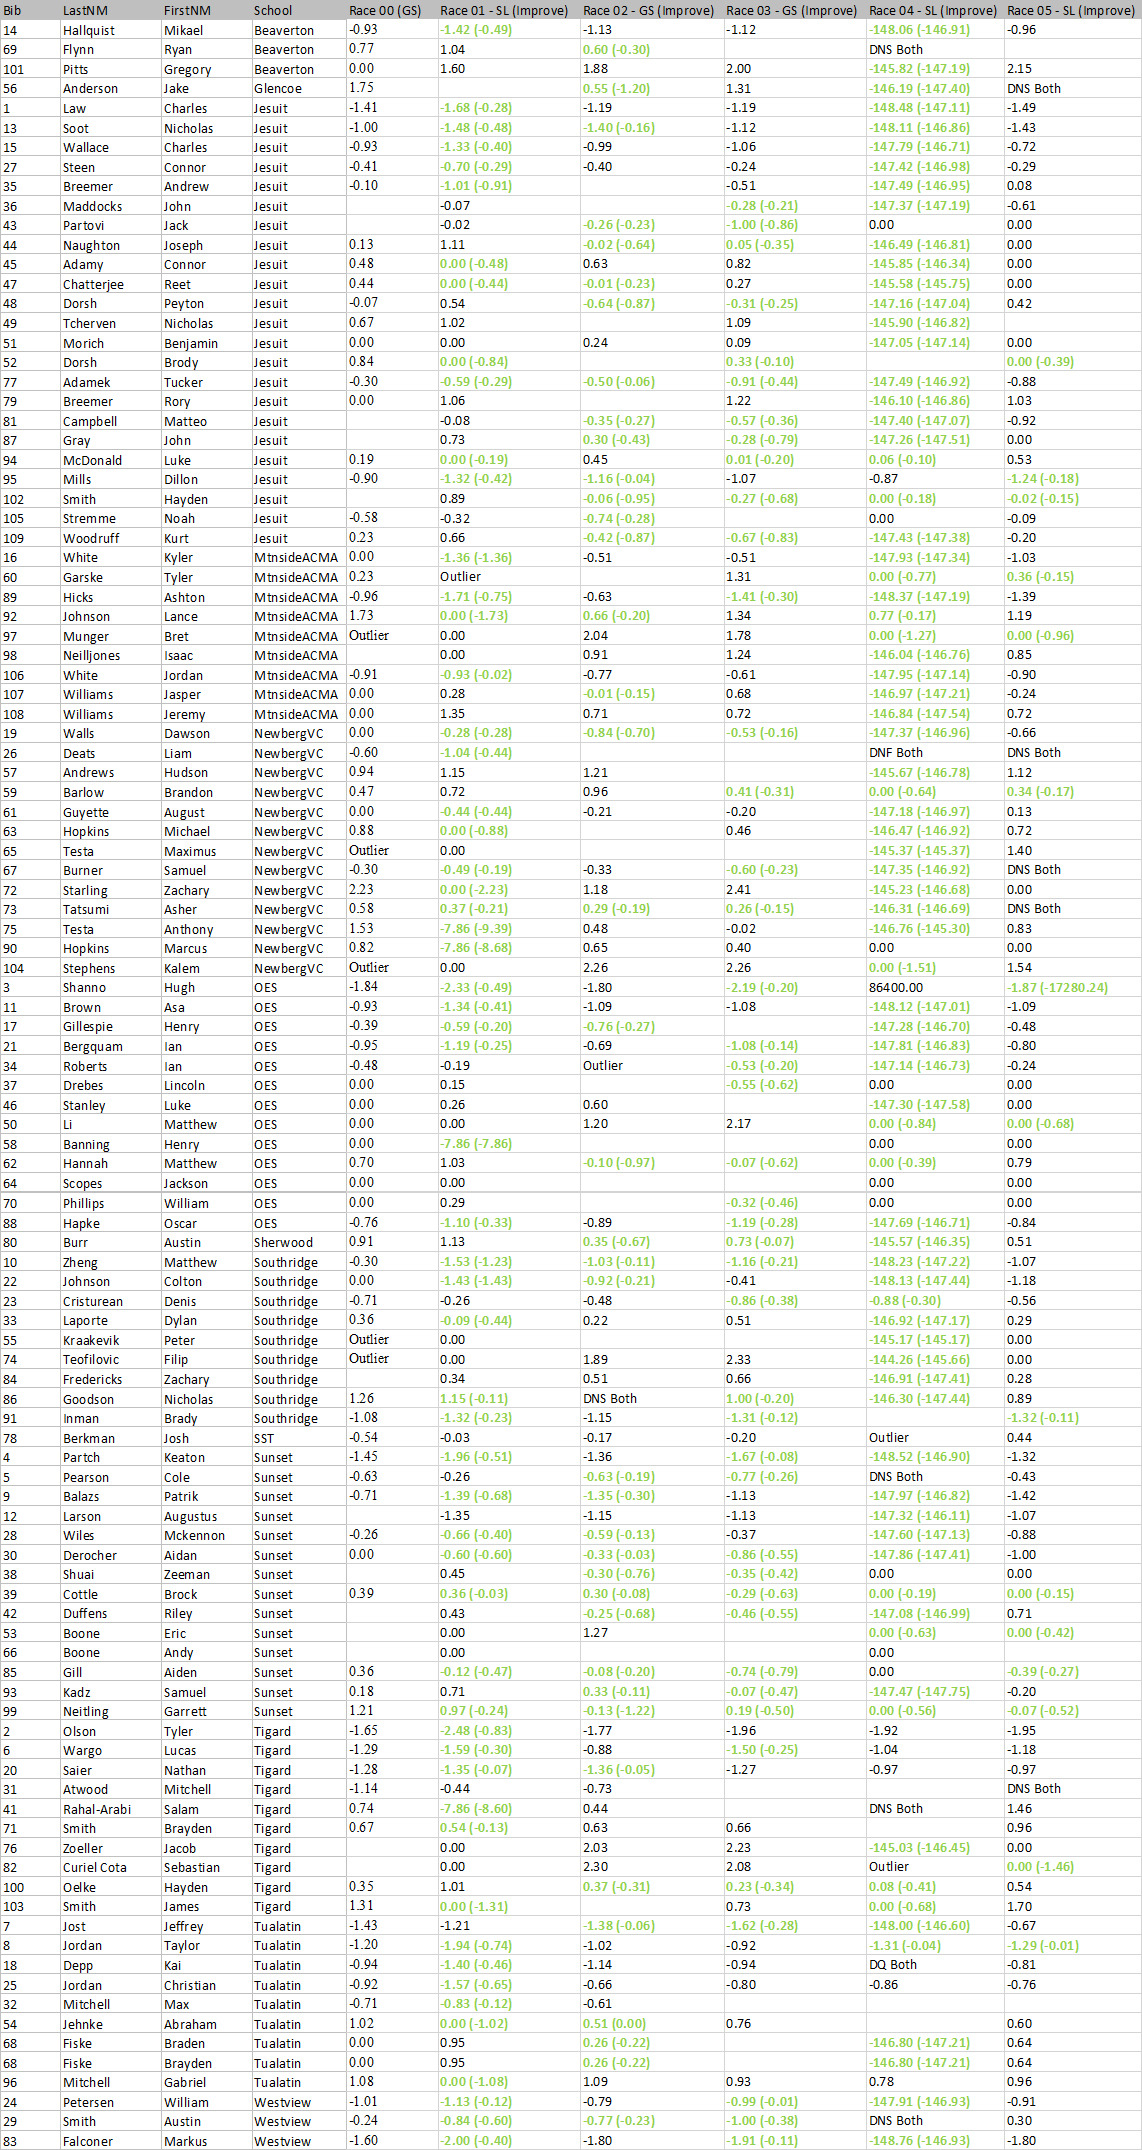
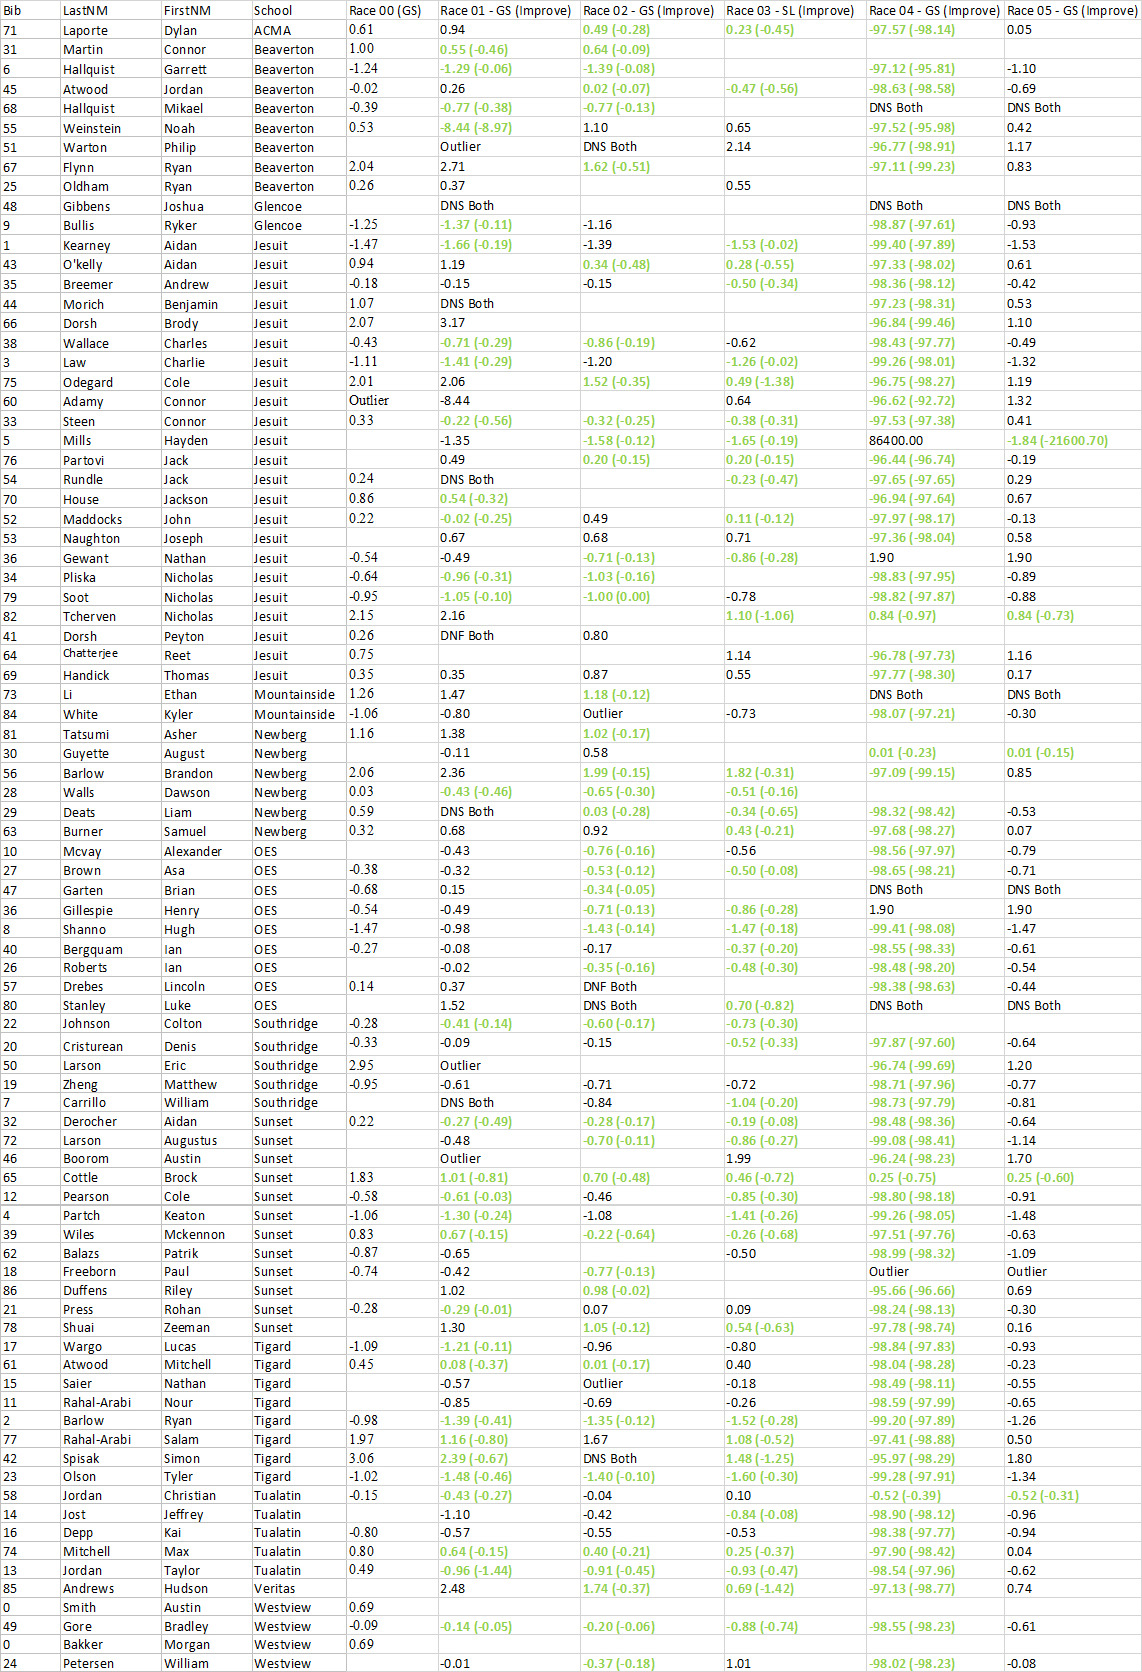
2019/20 Portland Oregon Metro League Boys
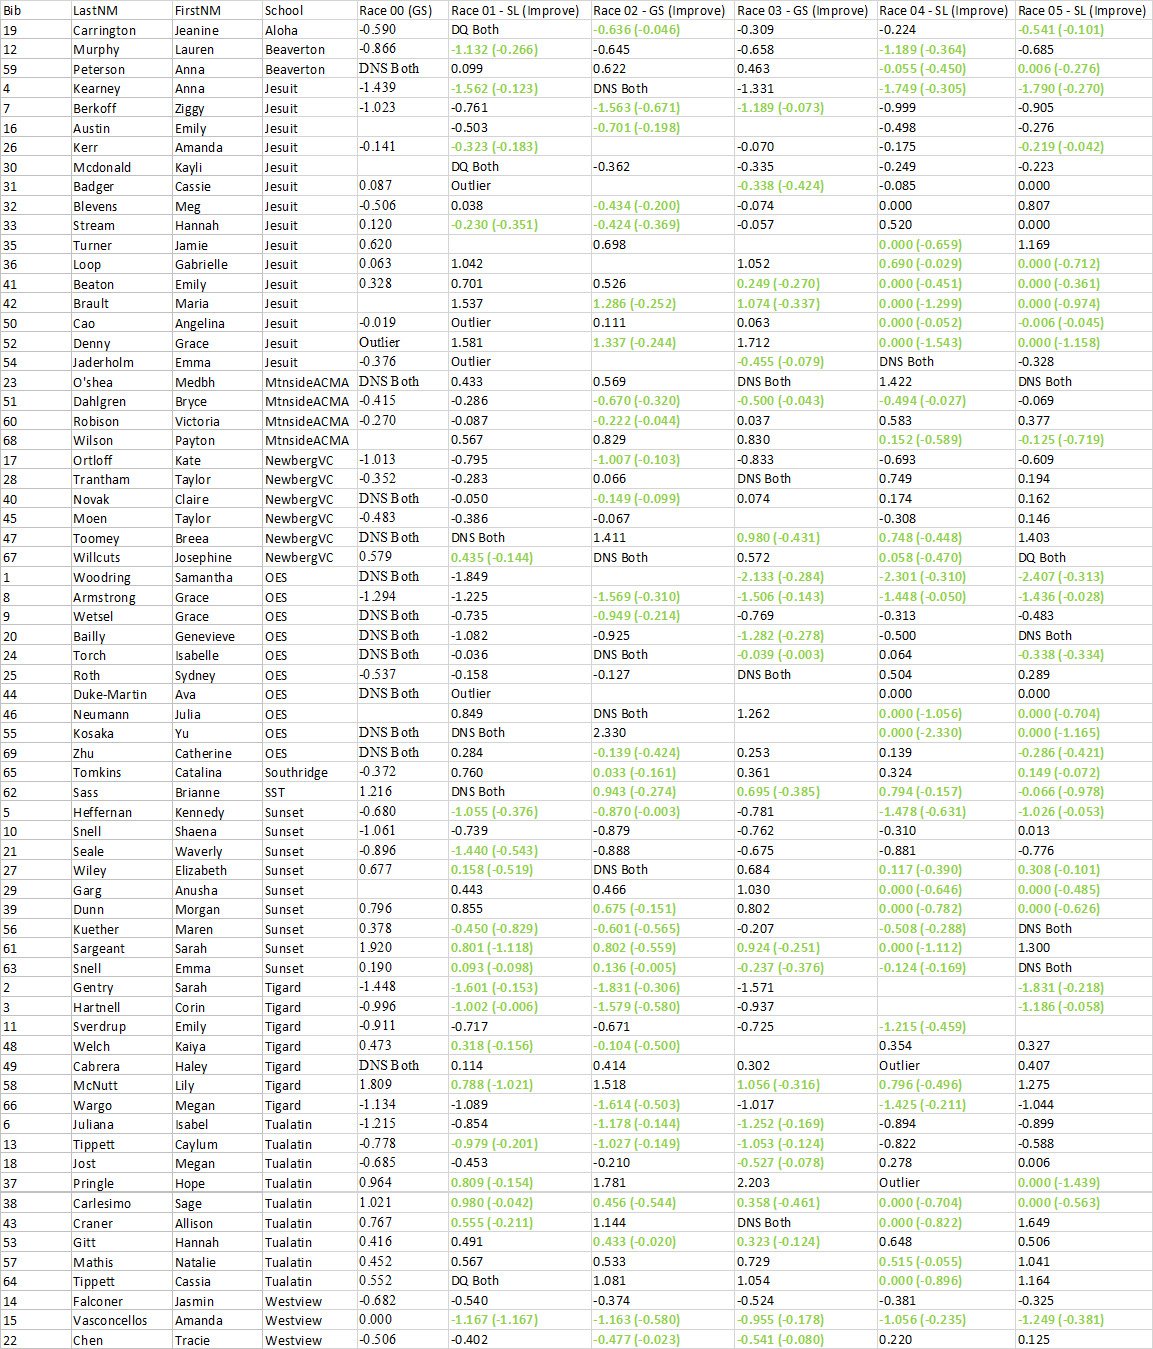
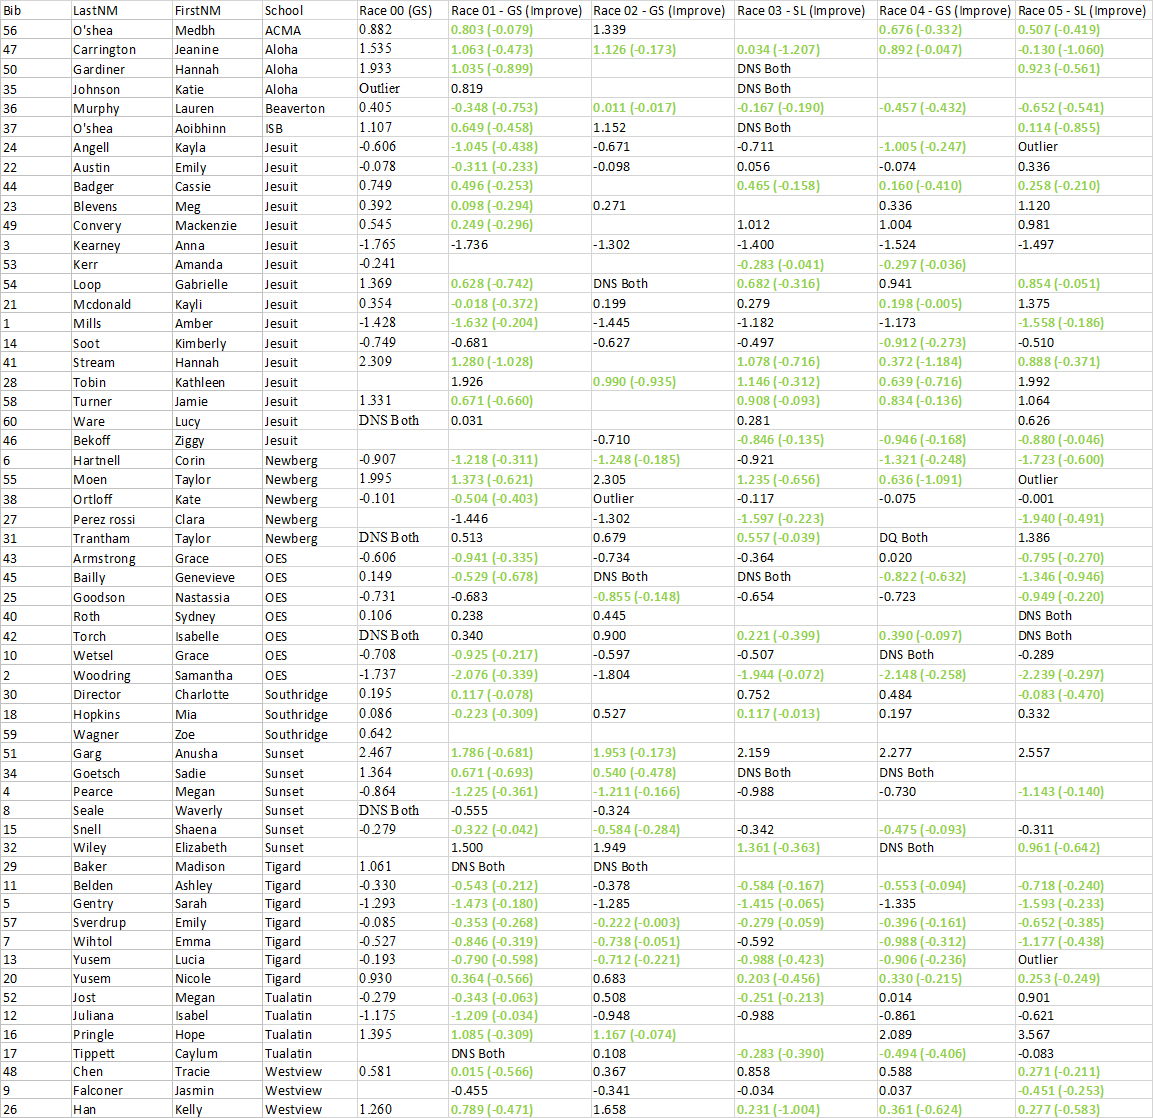
2019/20 Portland Oregon Metro League Girls
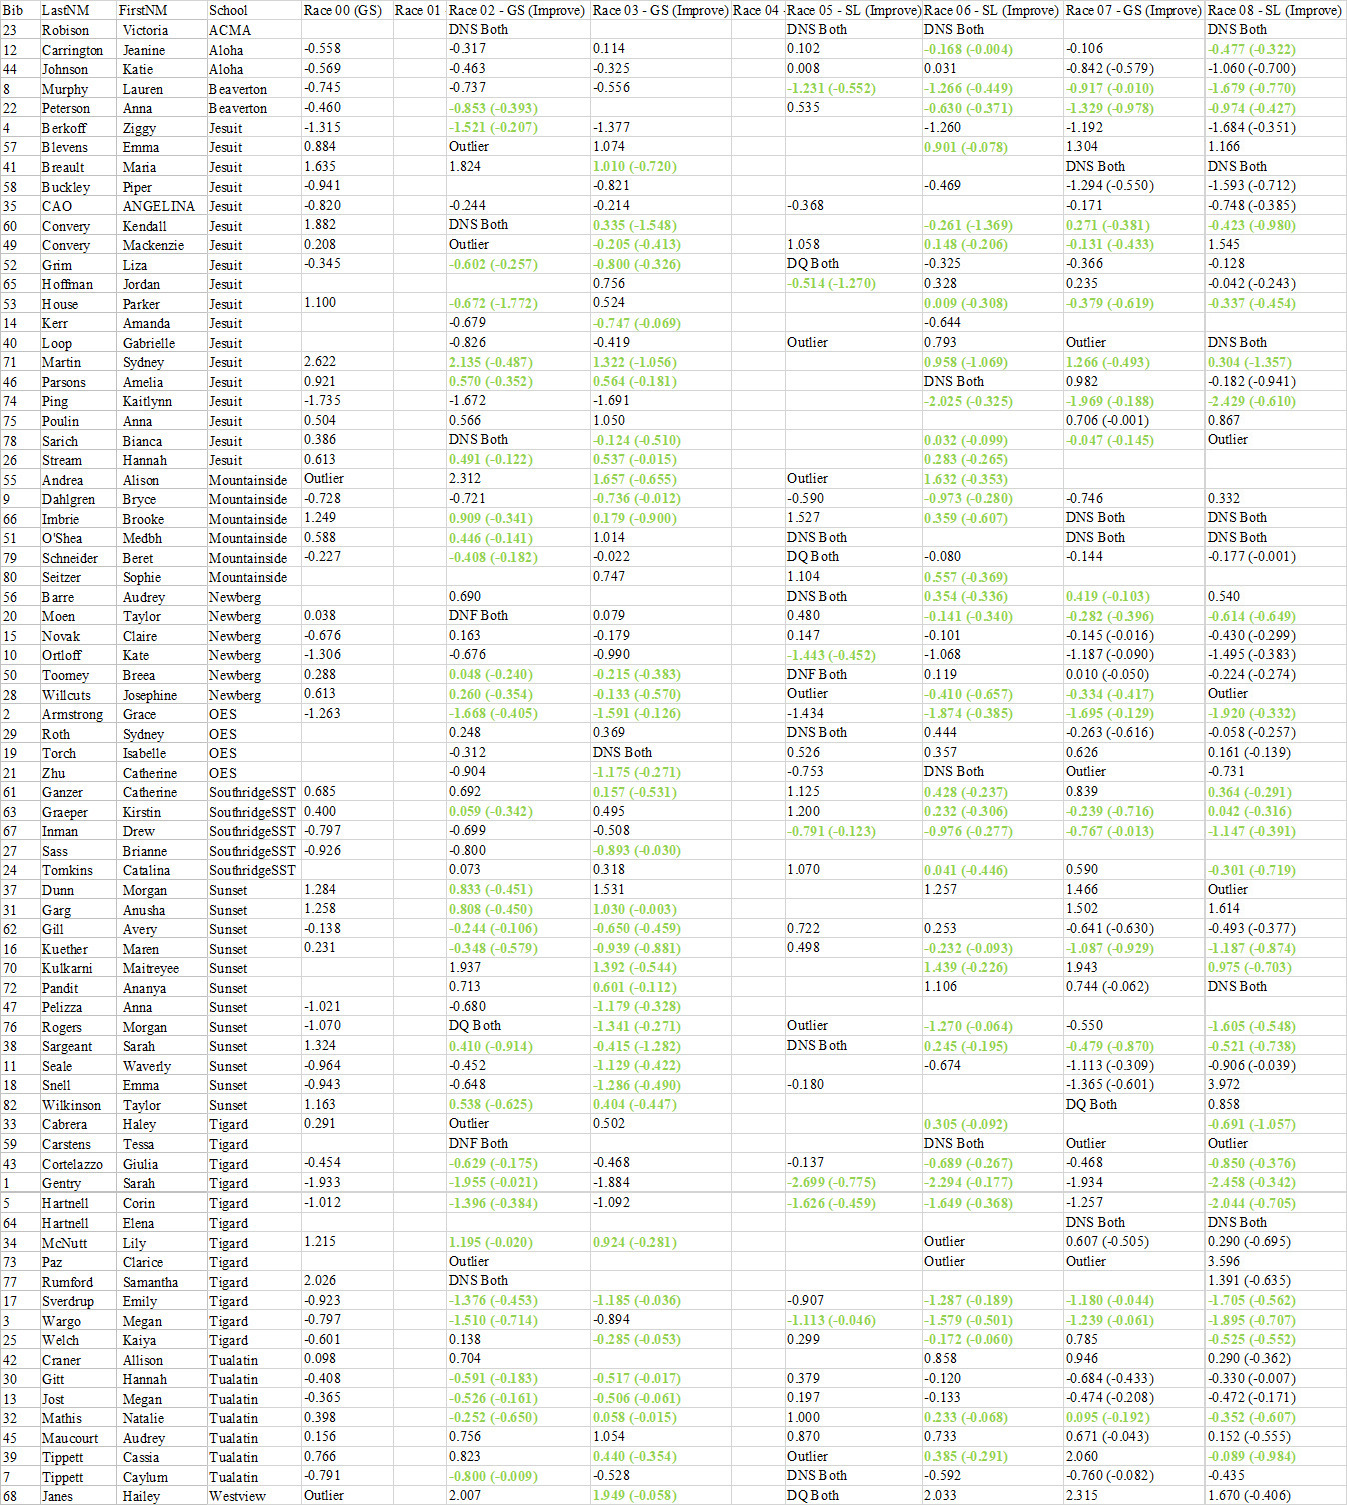
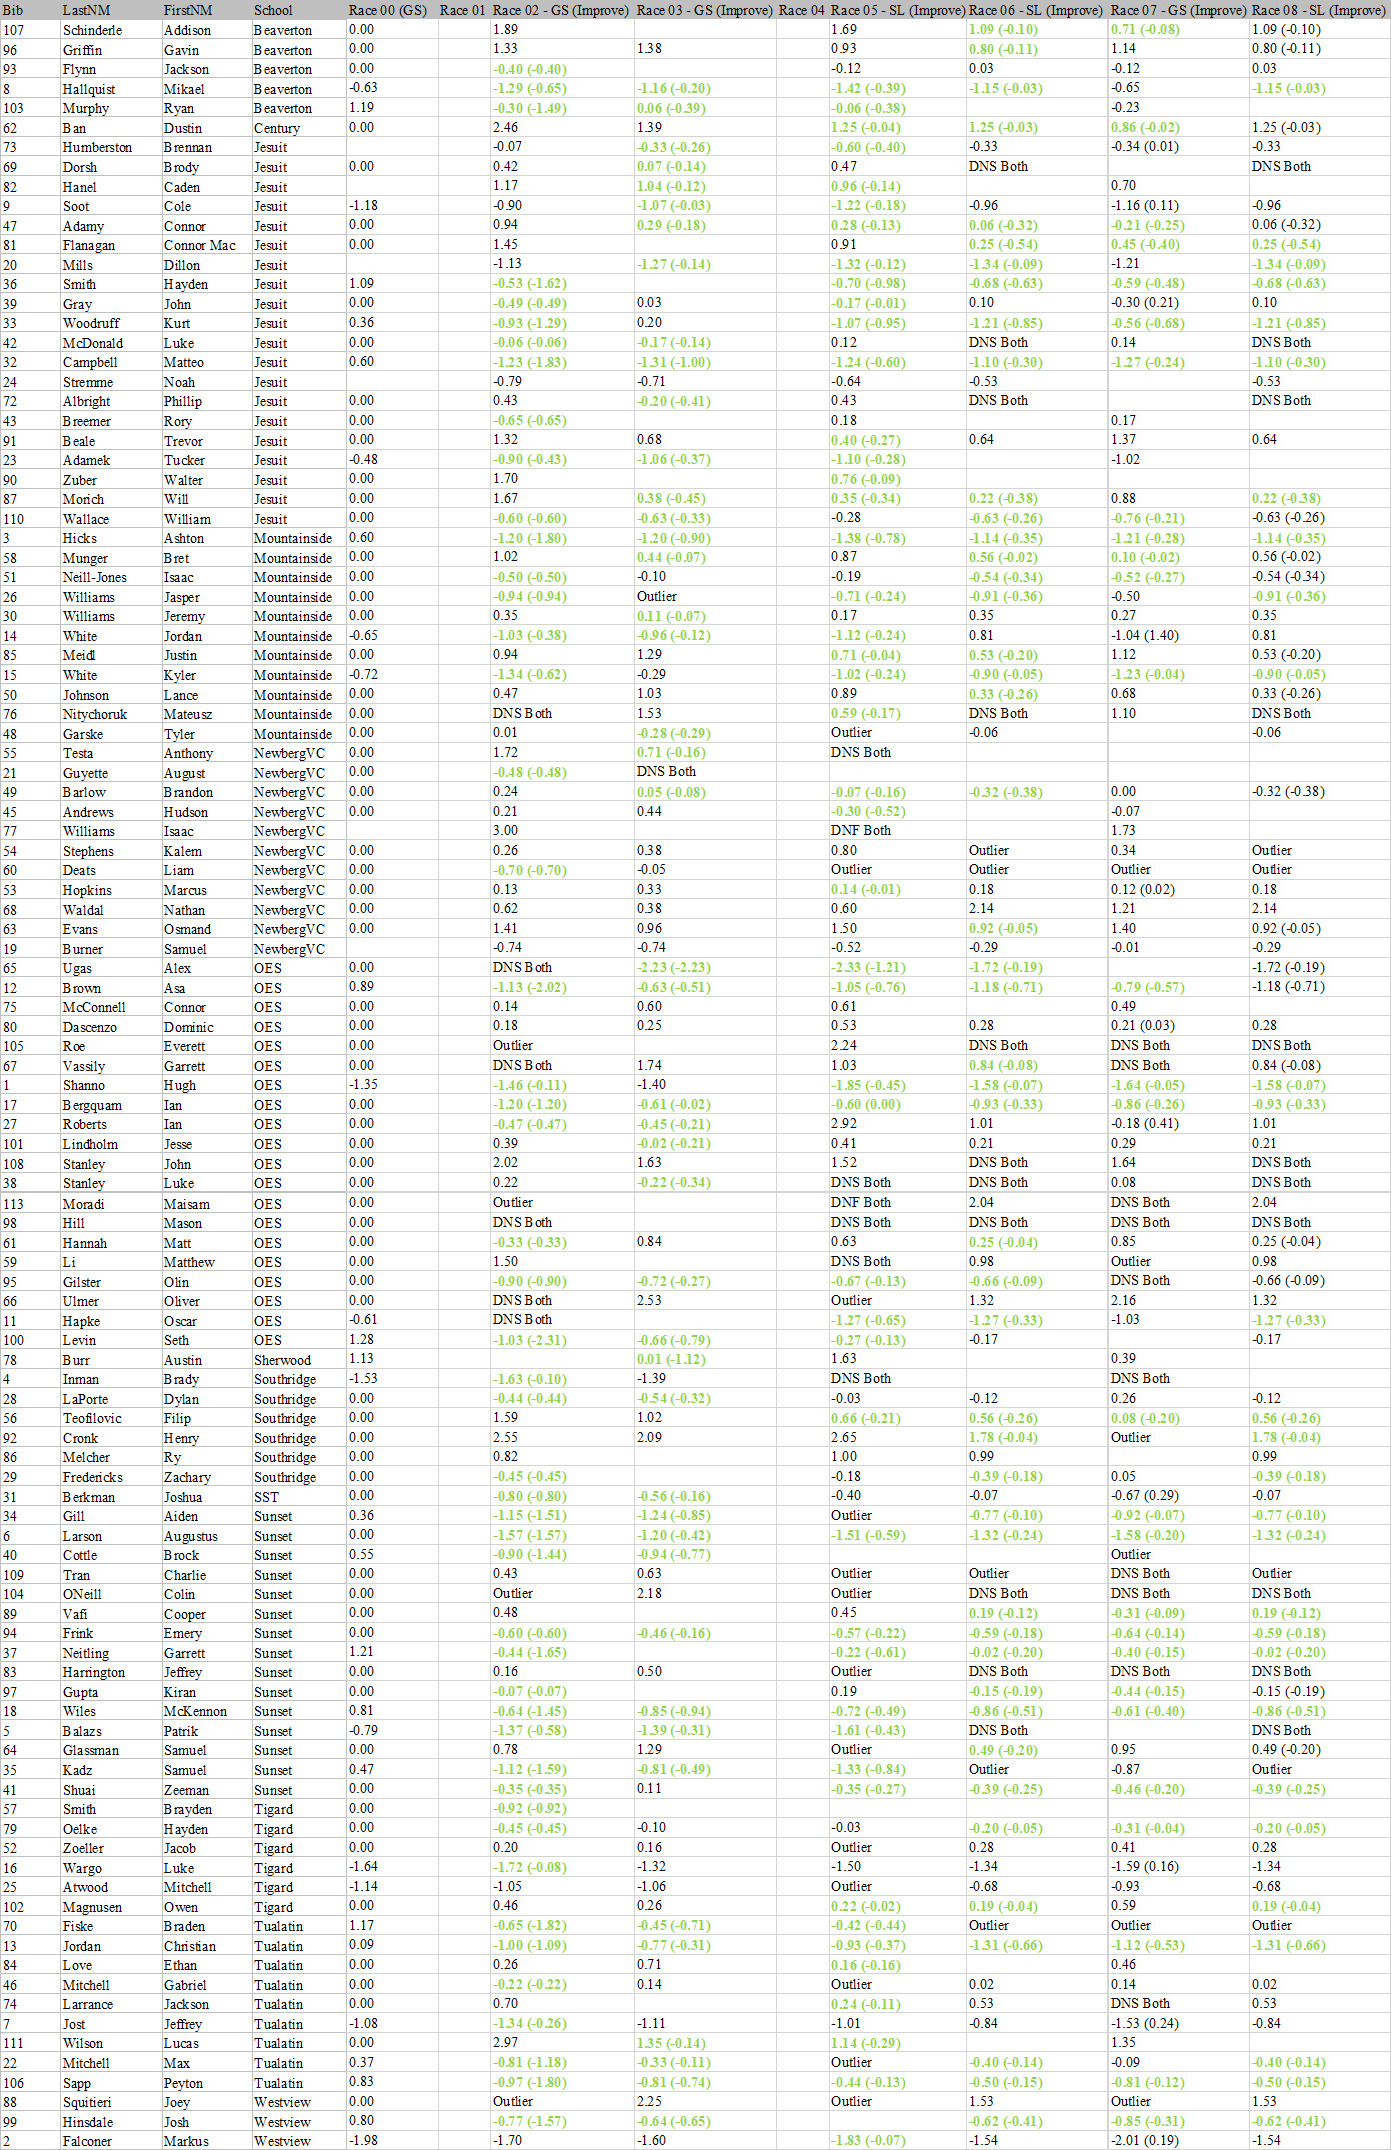
Legend: Blank = did not race; DNS = did not start; DNF = did not finish; DQ = Disqualified; Outlier = race time was too long to include (usually a fall).
Note: this year, two races were cancelled earlier in the year; therefore, a 7th and 8th race were added