Race Improvement Tables Explained
The goal of this project is to enable the racers to compare race results to their previous race performance and see whether they really improve from race to race throughout the season. For many sports it is easy to track individual improvement from race to race because the course and its conditions always stay exactly the same. Swimming is a good example of a sport in which one can track improvement by using the actual race times for an individual. The swimming pool is the same from race to race so that for a particular event such as 100M freestyle, a decrease in a half a second between races is obviously an improvement. The same is not true for ski racing. The problem for skiing is that the courses are different each race (longer/shorter, more gates/fewer gates, easier/harder, etc.). In addition, the overall conditions of the snow, weather, course, etc., can also vary. Therefore a decrease in race time from one race to the next says nothing about whether one actually improved. Similarly, end of race ranks cannot reliably track improvement. A few examples will suffice to show their unreliability for the task. Obviously, a skier lower in the pack where there may be wider differences in times between racers could improve their time tremendously and not change their ranking at all. Similarly, a skier may change their rankings by multiple spots with very small improvements in their race times simply because the times are bunched closely together. Further, one could have skied worse from one race to the next, but move up multiple rankings simply because others in the local ranking mix also skied worse; and a racer who finishes last through multiple races could improve tremendously while a racer who wins every race might not improve at all. It is just as important to hold the best racer (who always wins) to a standard of personal improvement as any other racer on the team. Winning is not an acceptable excuse for complacency.
Anecdotal observations or video review can be used to determine improvement in technical and tactical elements. However, they cannot tell one whether these changes actually produced an improvement in results from one race to the next. Many coaches (myself included), have watched skiers race and told them that they did much better than the previous race - maybe even using technical observations and changes in final rank in support. However, as the reader can see, without an objective methodology that avoids the problems discussed above, statements like these really hold very little objective weight when trying to compare race results.
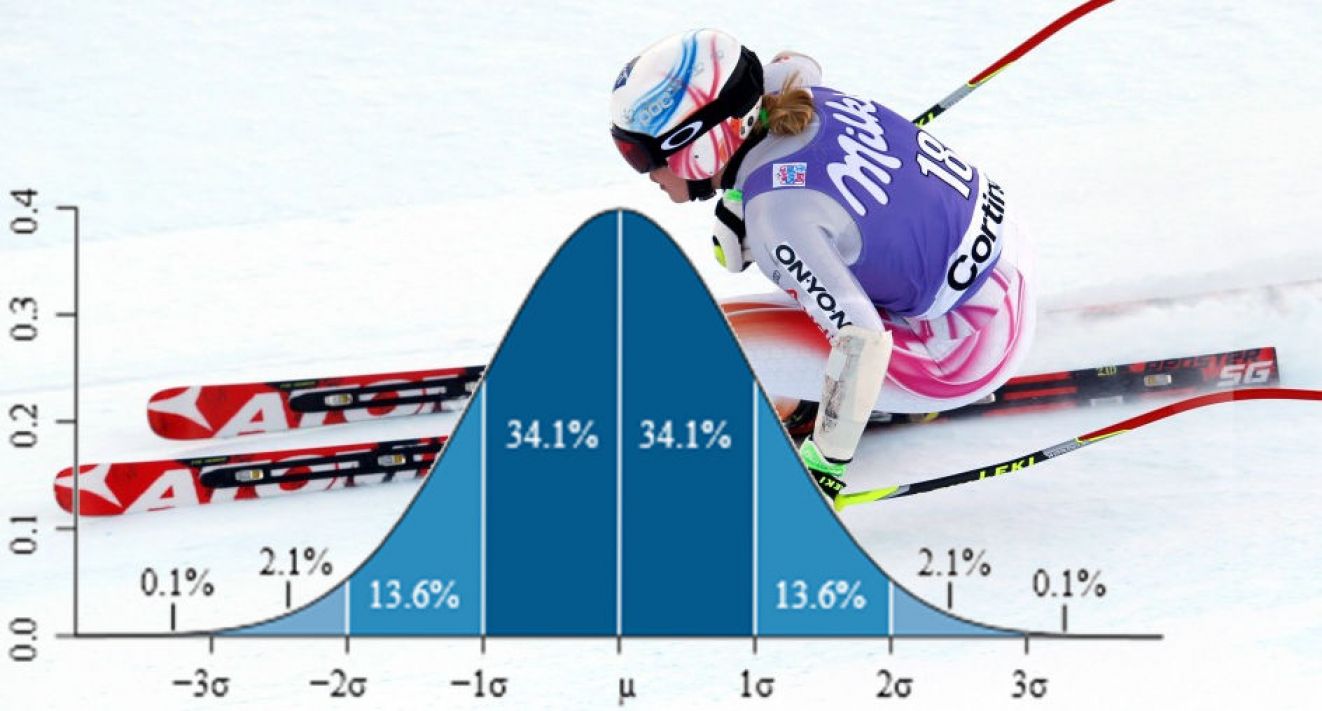
Transforming actual race times to Z scores offers a reasonable method for comparing performance from one ski race to the next. It puts varied race results on a common scale. The Z score is the amount of difference between a racer’s time from the event’s average time measured in standard deviations of the event’s results. A Z score of zero would be exactly the same as the event’s average time. A negative Z score indicates an above average result and a positive Z score indicates a below average result. Very simply, just as in the actual race times, a lower number is better. The advantage of a Z score over a rank is that it is an interval “distance” from the average. Therefore, improvements that would not be caught by changes in ranks are seen, over or underestimations of improvement indicated in the ranks are avoided, and every racer regardless of rank can be assessed for personal improvement.
In creating the table of Z scores, various initial decisions and data transformations had to be made. First, a decision had to be made of which race result to use. It’s common for several, skiers to either not start a run, not finish a run, or disqualify on a run. Therefore I have chosen to use each skier’s best run of the day as input for the Z score process rather than the combined time for both runs. This allows results for skiers who did did not finish both runs and most consistent with looking at each skier’s best potential. If a skier had no result for either run, a code for the reason was indicated in place of the Z score.
Additionally, a few skiers often fall each run and produce a time that is excessively slow when compared to the rest of the group. Including them skews the calculation of base statistics and so they were identified and eliminated from the actual Z score calculation. Initially, I calculated the mean and standard deviation, quartiles, and interquartile range of the raw race times for each run. From this I designated an “outlier cut-off.” Any race time that was slower than 1.5 times the interquartile range was eliminated from subsequent analyses. New mean and standard deviation for the “within interquartile range” scores were determined and used to calculate Z scores for each racers times. Outliers were indicated with a code in place of their actual results.
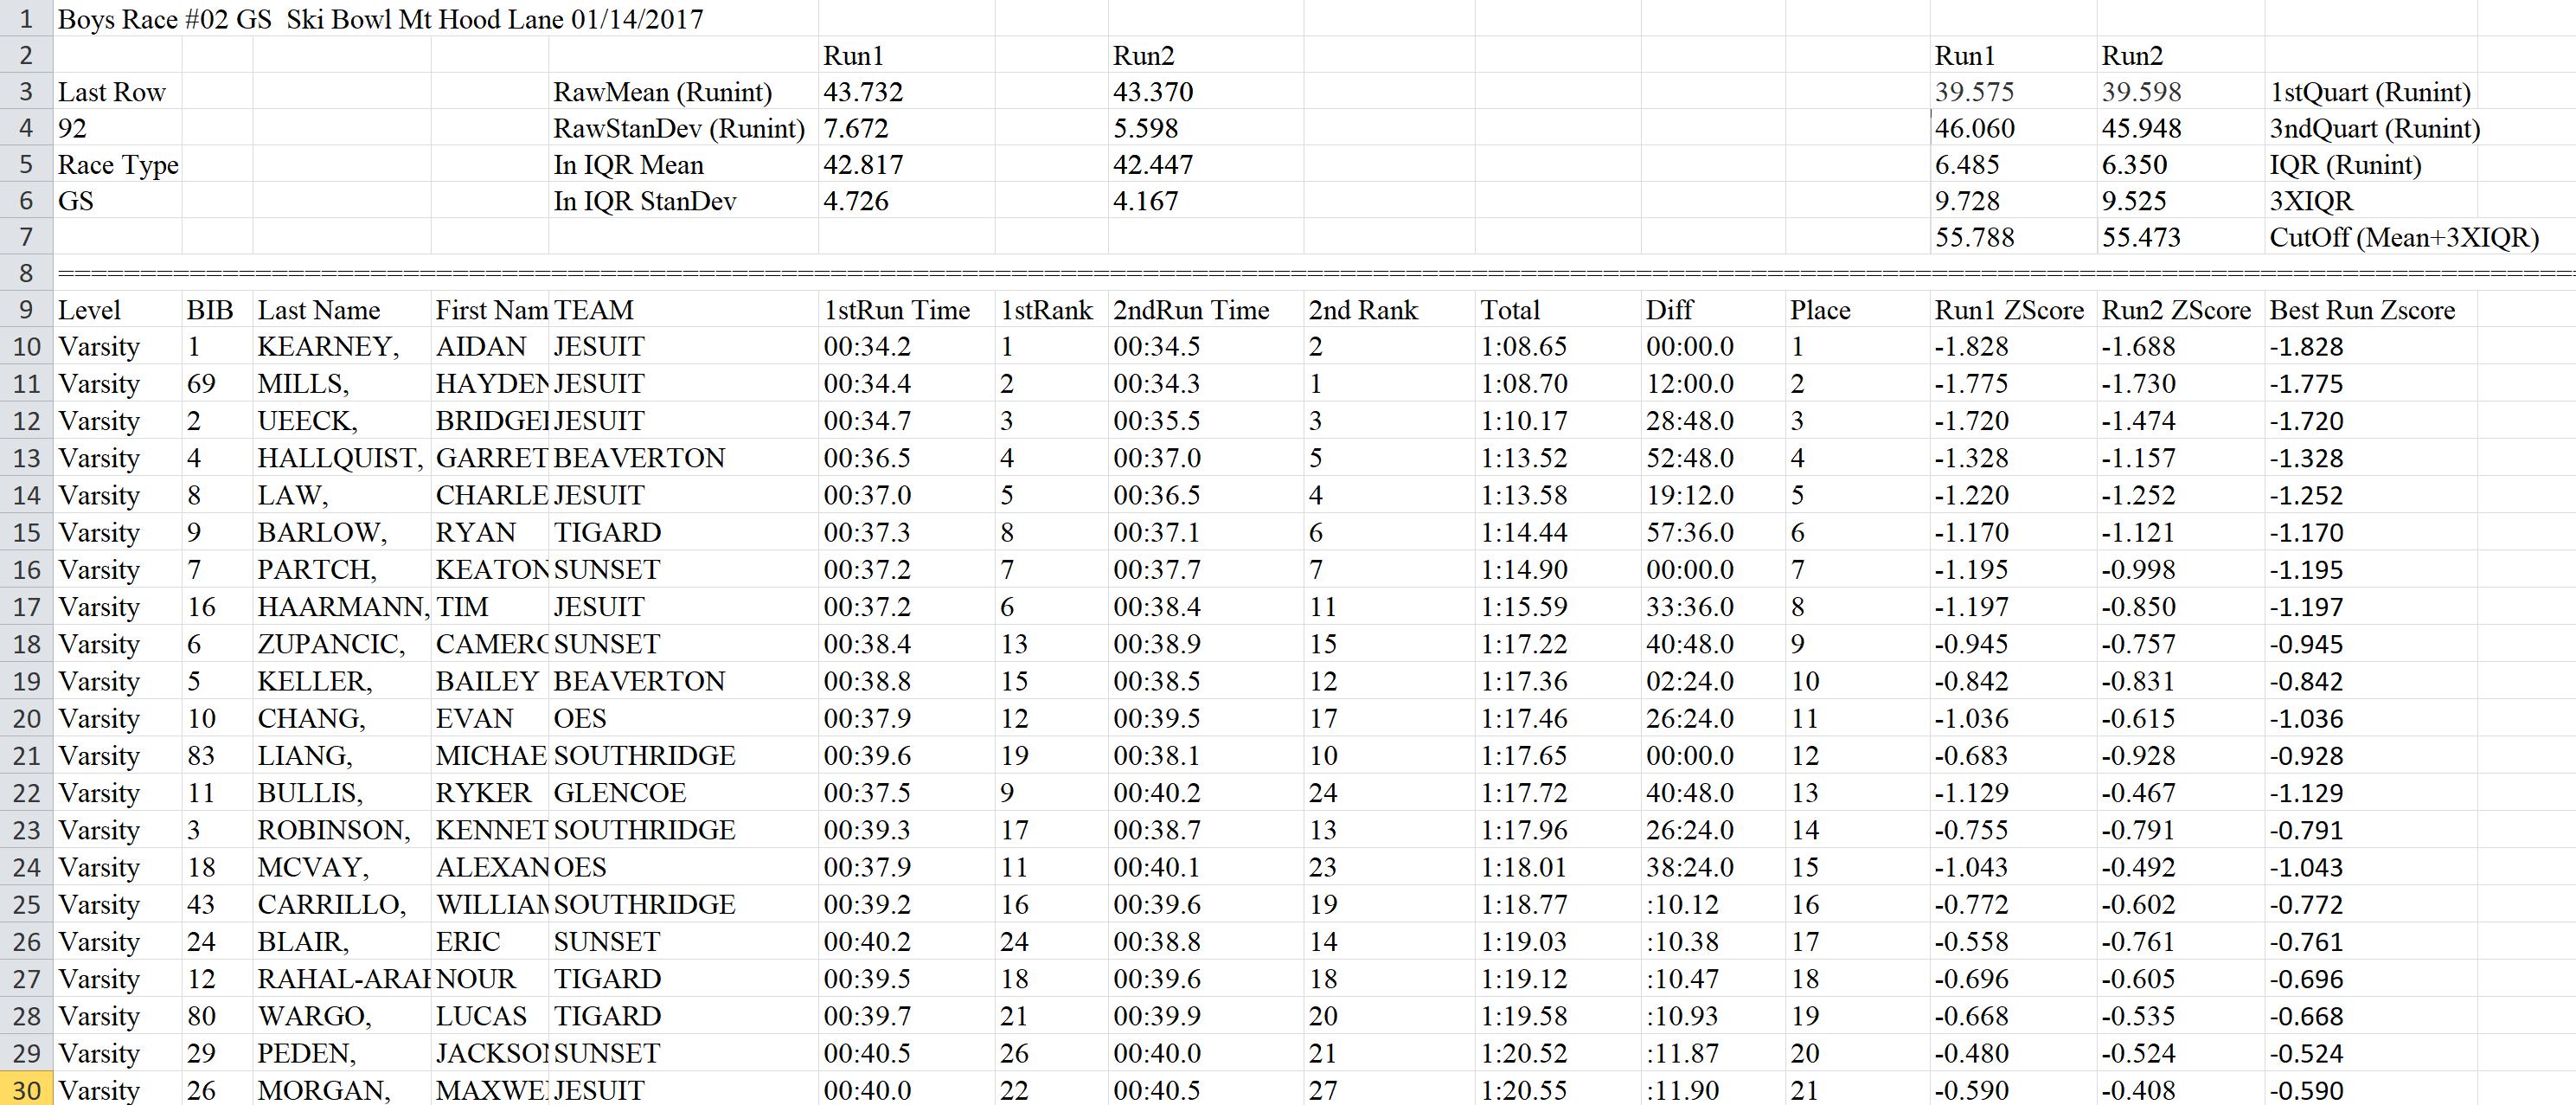
Using Excel, I created a workbook in which separate worksheets calculated a Z score for each racer’s best run of each race. Below is an example for one such race:
These results were combined into an overall sheet in which racers were listed in rows and each skier's best run Z score appeared in columns:
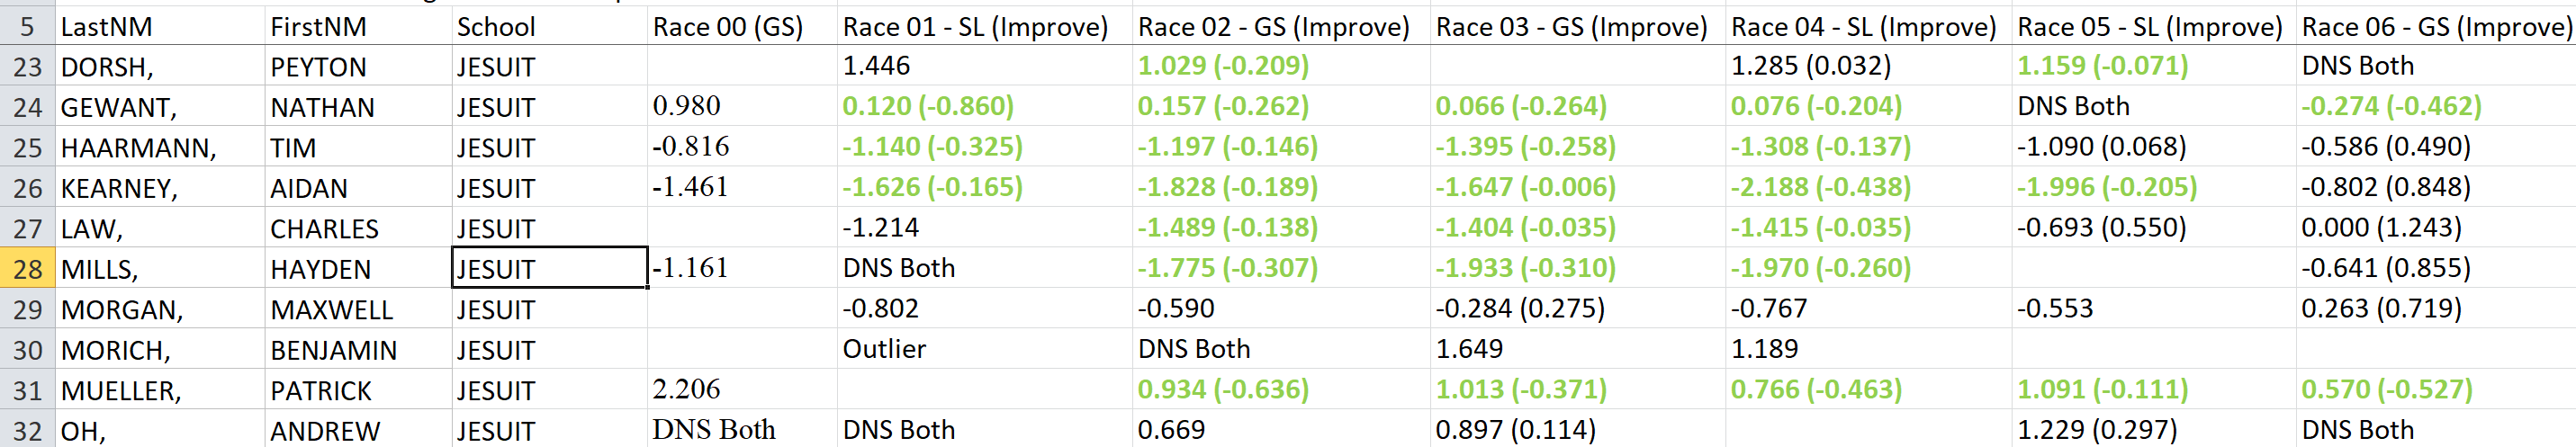
This allowed racers to simply look across the table for their individual results and see the changes in Z scores from one race to the next. Additionally, I chose to highlight Z scores for each race that exceeded the average past performance for each racer. That is, whenever a Z score was better than the average of all past races for that skier, it was considered an improvement. In this way improvements over the skiers overall past performance were automatically highlighted. For race results that improved, I also included the amount of improvement (in parentheses). This can be used for picking out the team’s most improved skiers each race. The information from this combined sheet was updated and posted on this website as each race happened.
I hope the team finds tracking their personal performance from race to race useful. Remember, gathering more systematic and objective data on improvement is just the start of a bigger process for each skier. After each race, two general questions should be asked of each skier.
1) If the skier improved on a race, they should ask themselves what they did in their technique, tactics, or preparation to make that happen. Carry this recognition into the next race.
2) If the skier did not improve on a race, they should ask themselves why and what they will do differently in technique, tactics, or preparation for the next race.
Having each skier consider these questions and discuss their ideas with their coaches and team mates is important. It’s also important to have a long term view and not get too impatient about “instant” changes from race to race. Though breakthroughs can happen, technical learning most often translates into better race results over time. Tracking your progress is important, but it’s how you use this information that is most important.
Coach Peterson
* A note on use of the data in the improvement tables. The tables are meant for individual skiers to compare their best run results to their own previous best run performance. One must be very careful in trying to make comparisons between skiers. while it may be reasonable to compare the calculated amount of improvement each skier had in relation to their own past performance and pick out a most improved skier, it would not be appropriate to use the raw Z scores shown in the overall table for purposes of comparing skiers or groups of skiers. The raw Z scores for two skiers in this table may come from different runs in the same race.
** To look about a similar research project examining the individual performance of PGA golfers, you can read "PGA Tour Scores as a Gaussian Variable" by Robert D. Grober from Yale University.